> ## Documentation Index
> Fetch the complete documentation index at: https://wb-21fd5541-workspaces-notebooks.mintlify.site/llms.txt
> Use this file to discover all available pages before exploring further.
# Developer tools
Use the developer panel to troubleshoot notebook code, inspect execution, view logs, and access the terminal.
 ## Open the developer panel
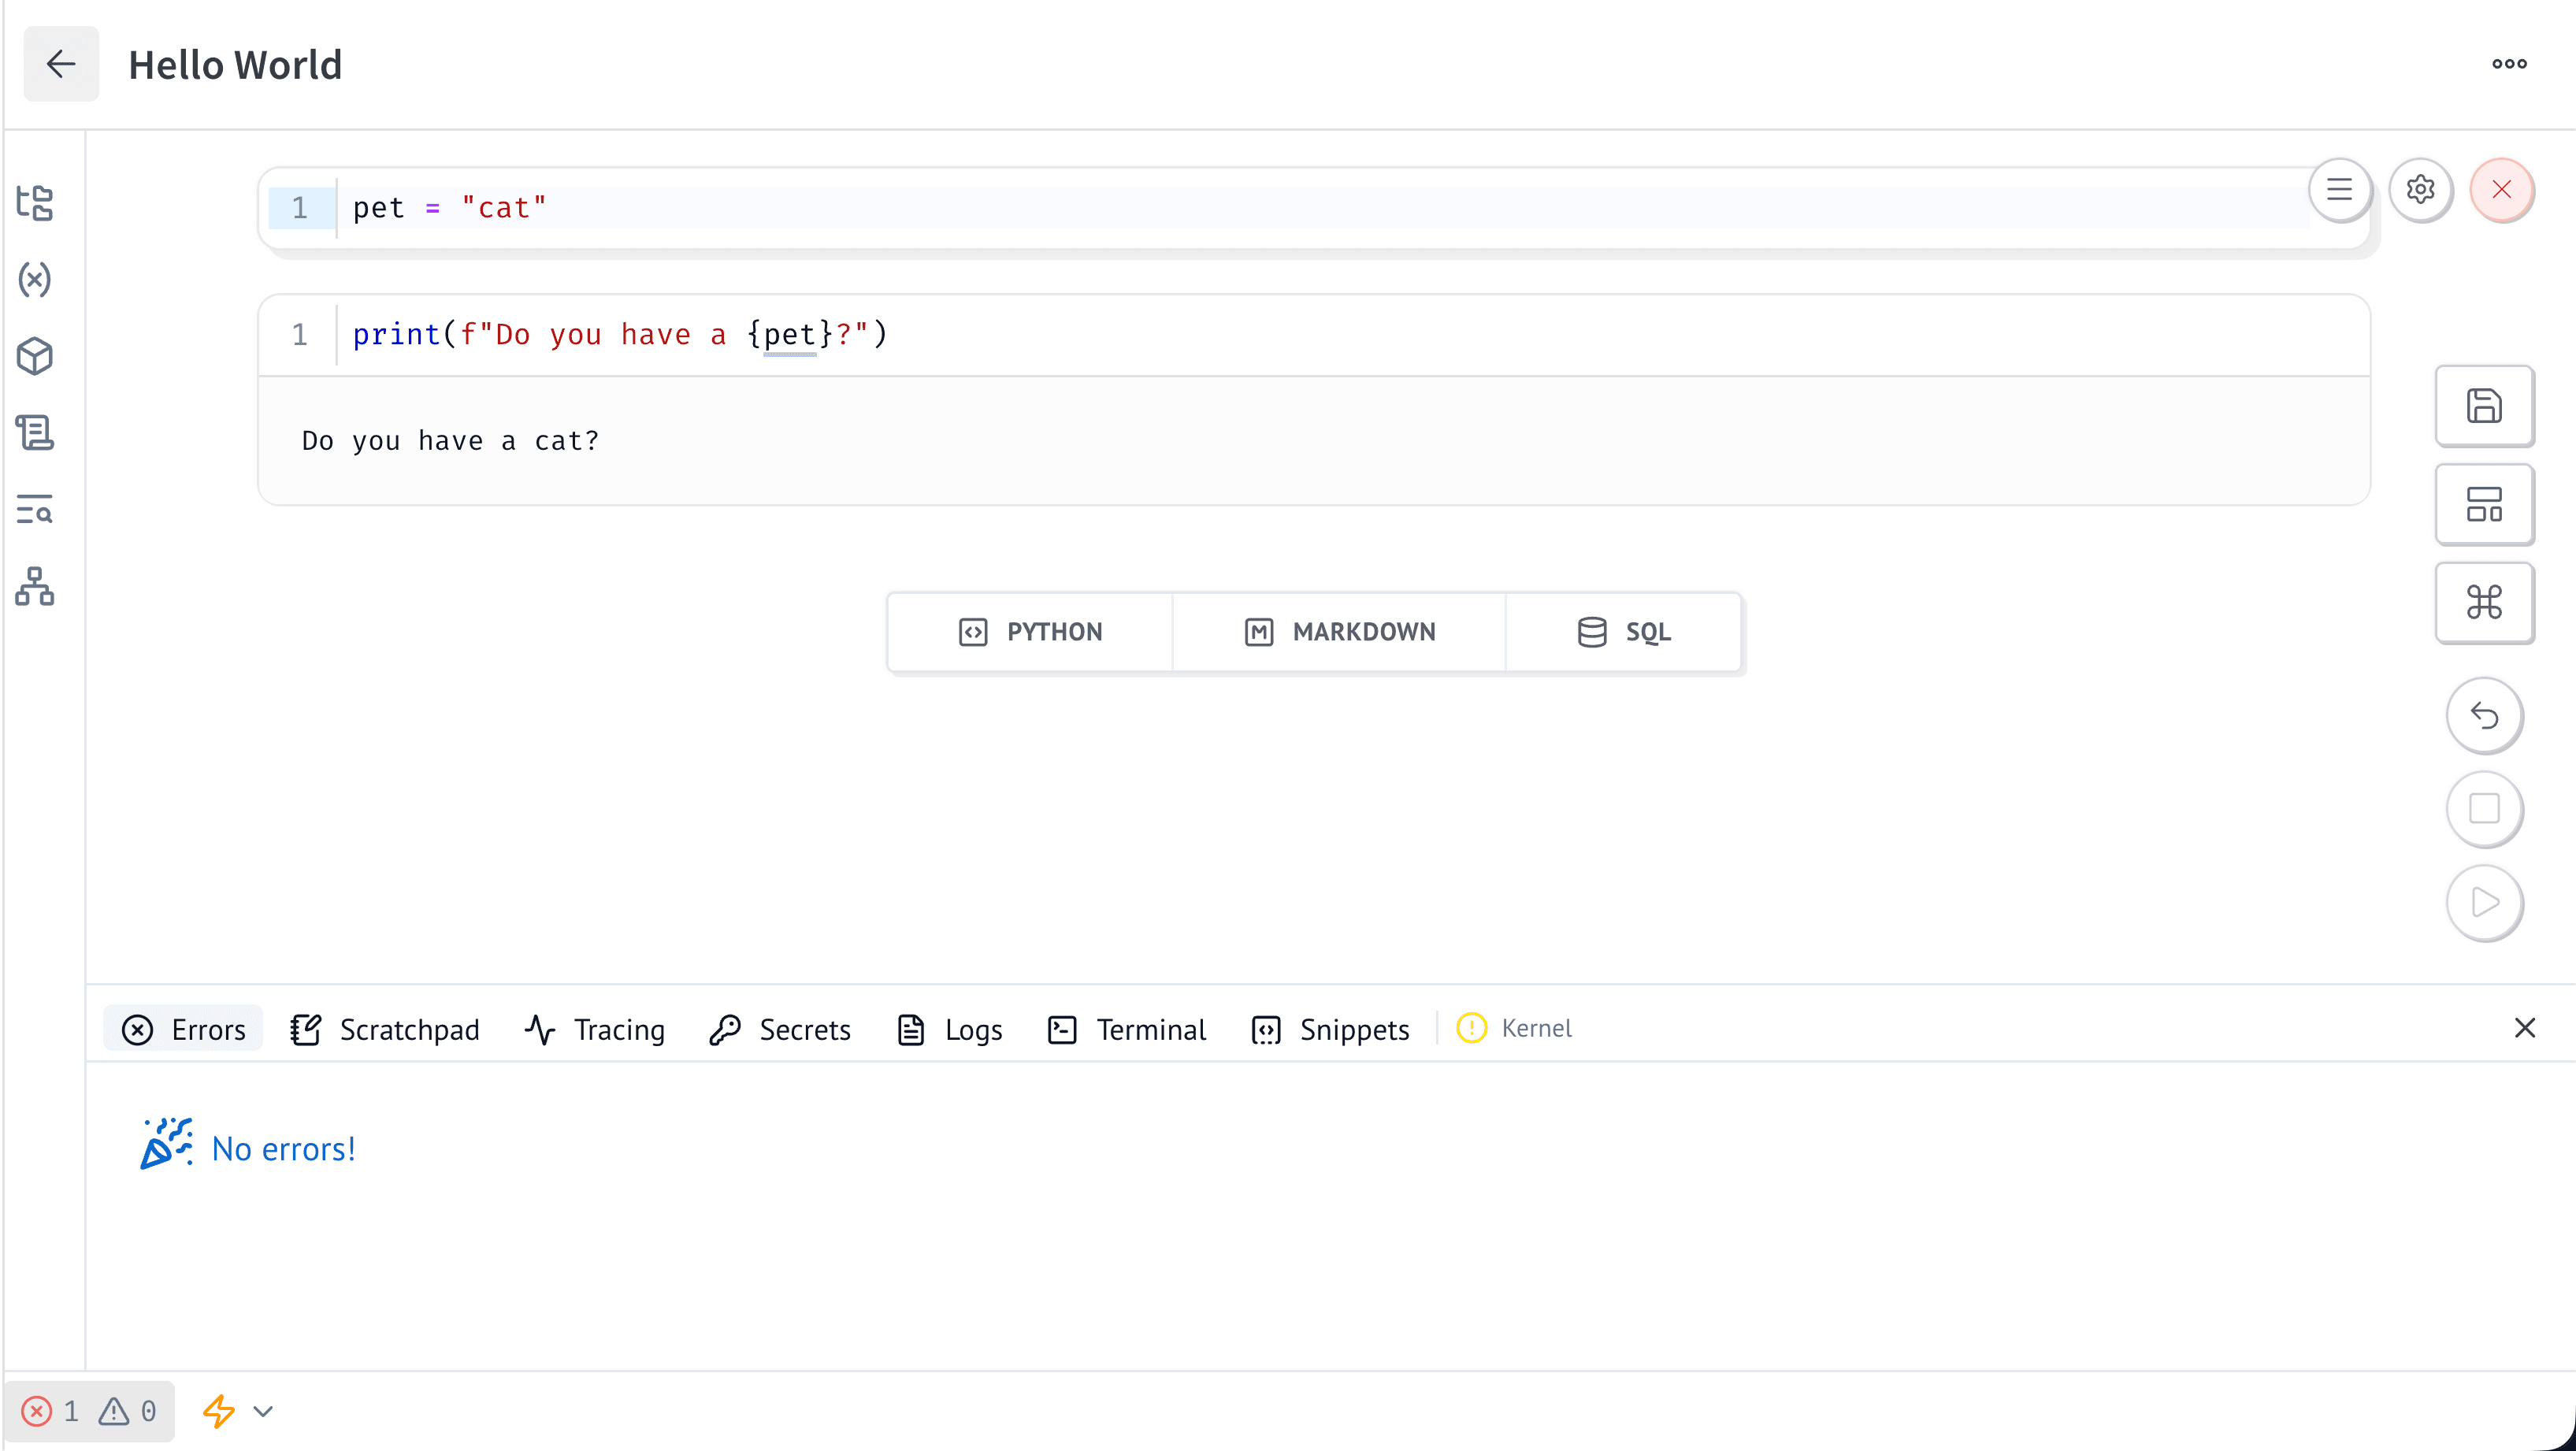
In the notebook footer, select Developer panel, located to the left of the notebook run button ().
Press **Command+J** on macOS or **Control+J** on Windows or Linux to open or close the developer panel.
## Inspect errors and warnings
Use the **Errors** tab to view errors and warnings throughout the notebook, including Python exceptions, syntax errors, cycles, invalid reactive dependencies, and variables defined in multiple cells.
## Use the scratchpad
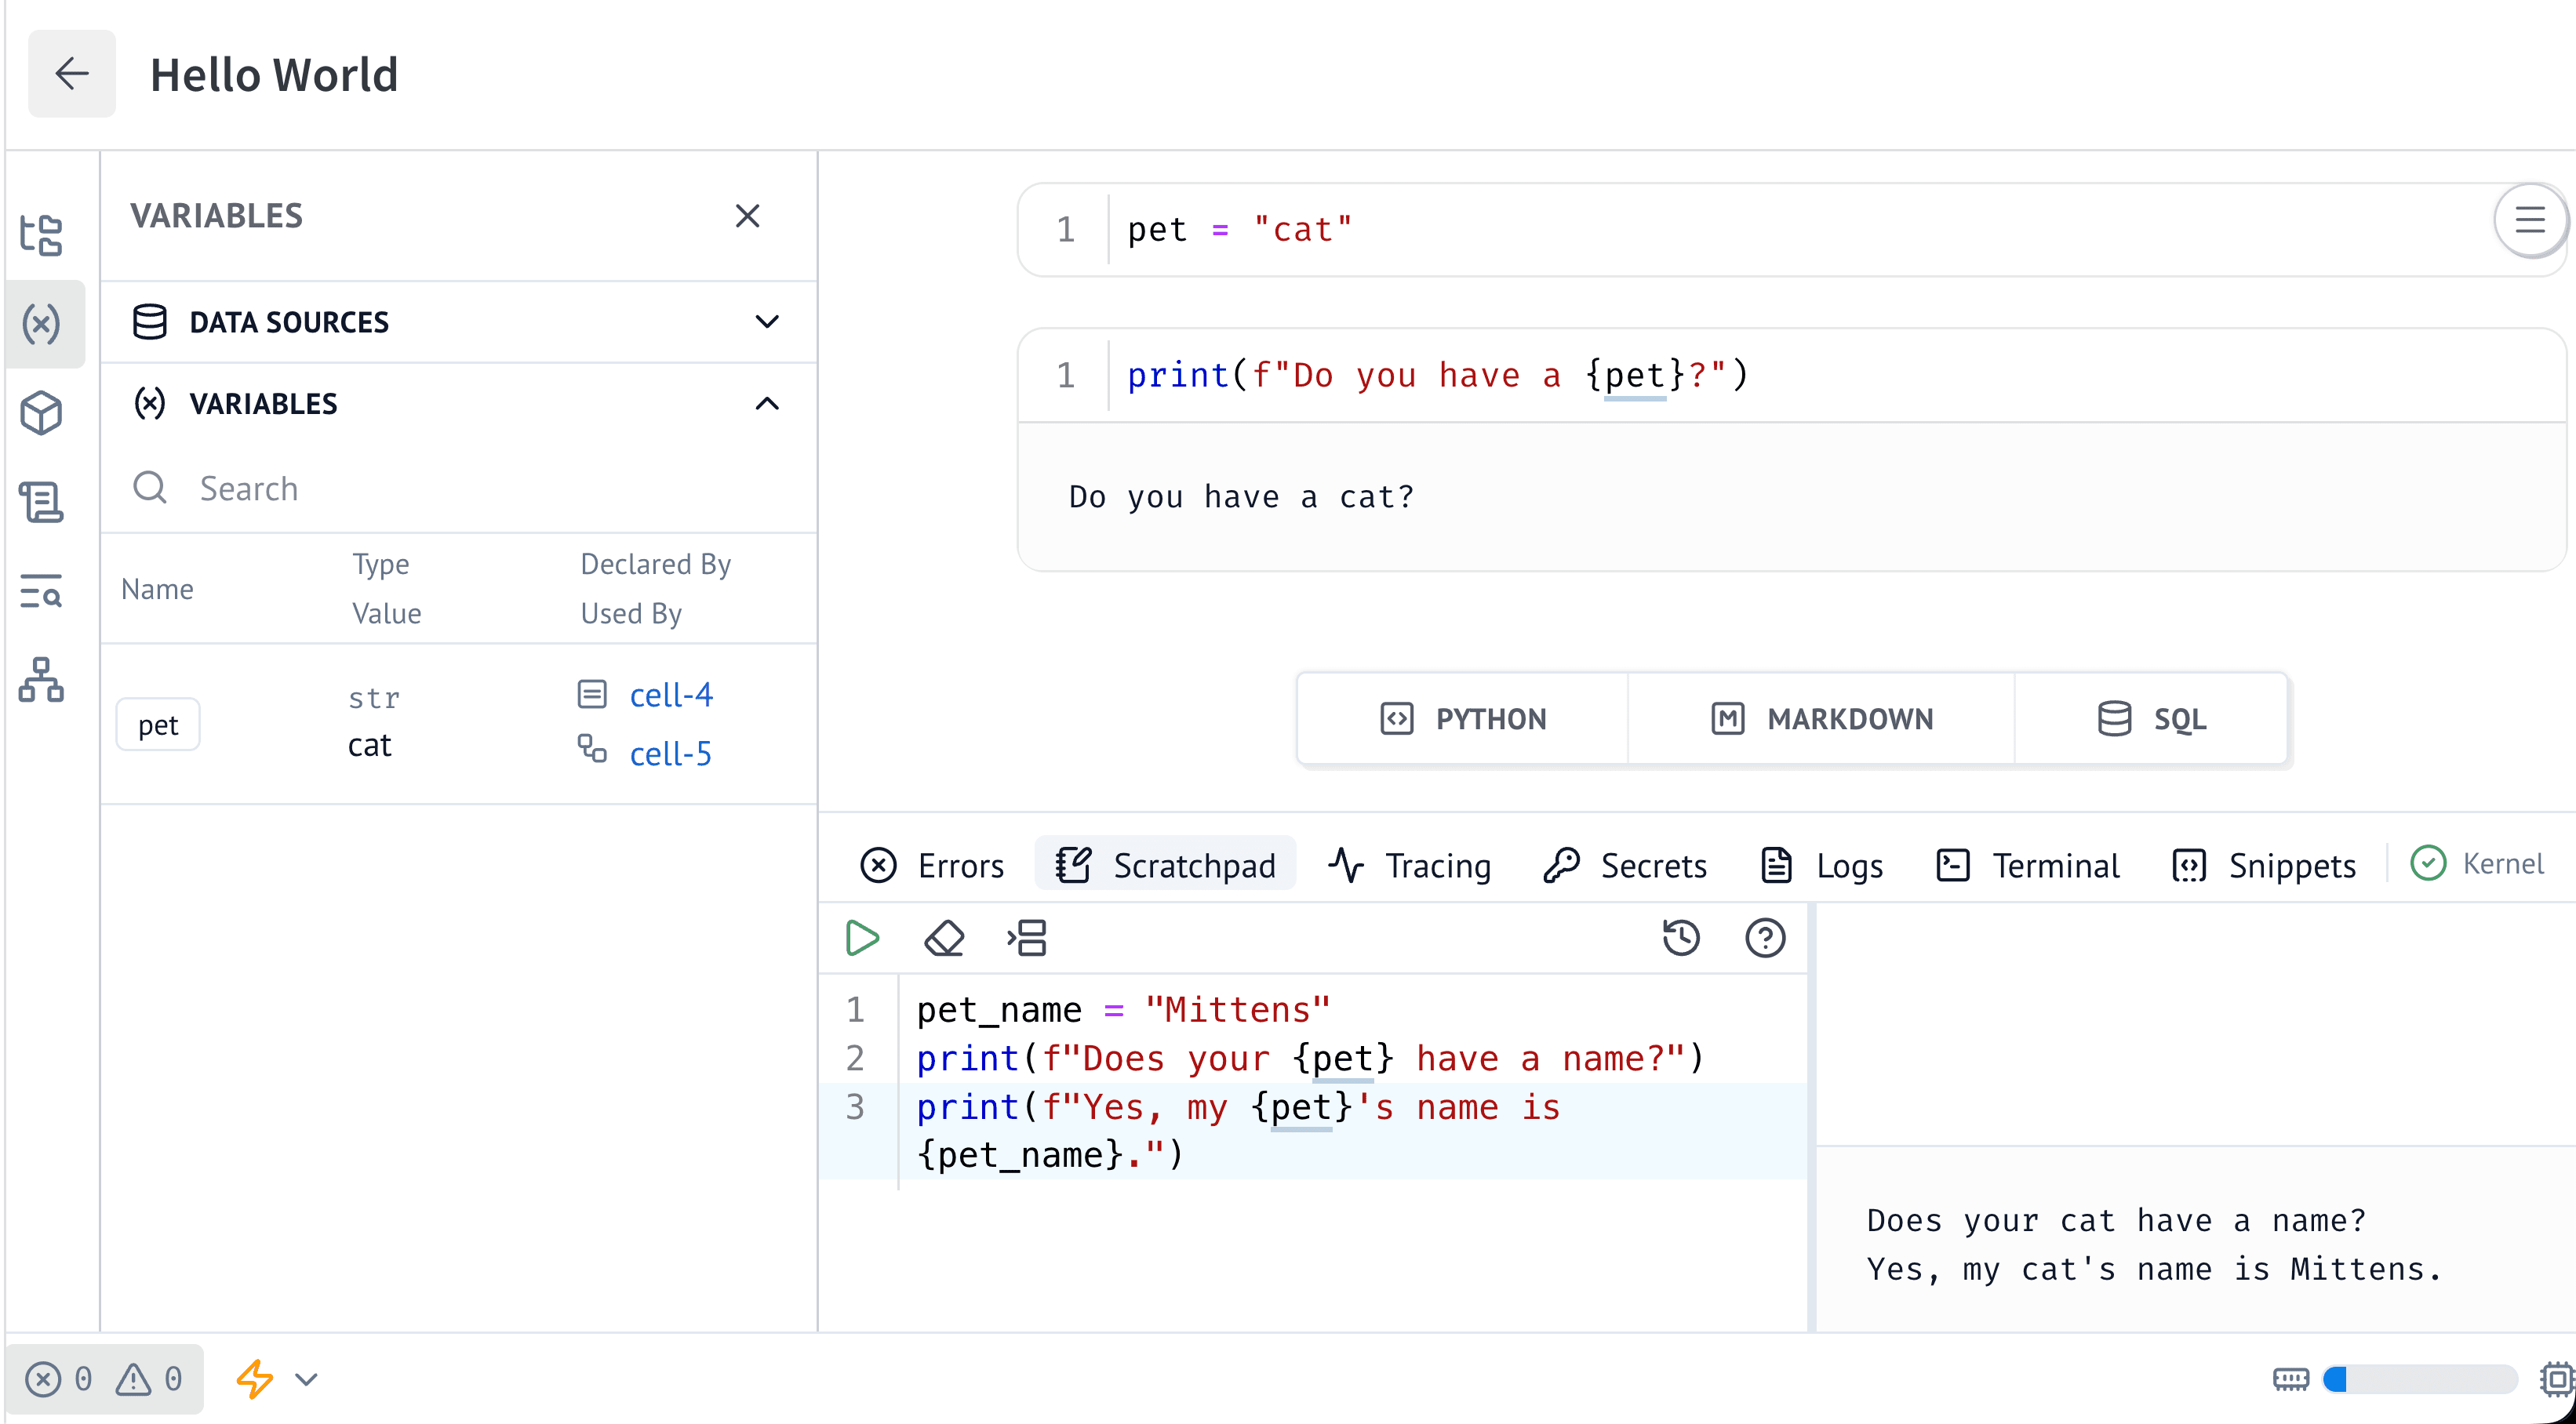
Use the **Scratchpad** tab to run temporary Python code without adding it to the notebook's reactive graph. The scratchpad can access variables defined by notebook cells.
Unlike notebook cells, the scratchpad doesn't enforce unique global variable names. Code and variables defined in the scratchpad are not saved. Copy any code that you want to keep into a notebook cell.
To run the scratchpad code, press **Command+Enter** on macOS or **Control+Enter** on Windows or Linux. Alternatively, select **Run** ().
Scratchpad output appears to the right of the code.
## Open the developer panel
In the notebook footer, select Developer panel, located to the left of the notebook run button ().
Press **Command+J** on macOS or **Control+J** on Windows or Linux to open or close the developer panel.
## Inspect errors and warnings
Use the **Errors** tab to view errors and warnings throughout the notebook, including Python exceptions, syntax errors, cycles, invalid reactive dependencies, and variables defined in multiple cells.
## Use the scratchpad
Use the **Scratchpad** tab to run temporary Python code without adding it to the notebook's reactive graph. The scratchpad can access variables defined by notebook cells.
Unlike notebook cells, the scratchpad doesn't enforce unique global variable names. Code and variables defined in the scratchpad are not saved. Copy any code that you want to keep into a notebook cell.
To run the scratchpad code, press **Command+Enter** on macOS or **Control+Enter** on Windows or Linux. Alternatively, select **Run** ().
Scratchpad output appears to the right of the code.
 ## Inspect execution traces
Use the **Tracing** tab to inspect the order and duration of cell executions. Traces can help you identify slow or failed cells and determine which cells ran during a reactive execution event.
### Read an execution trace
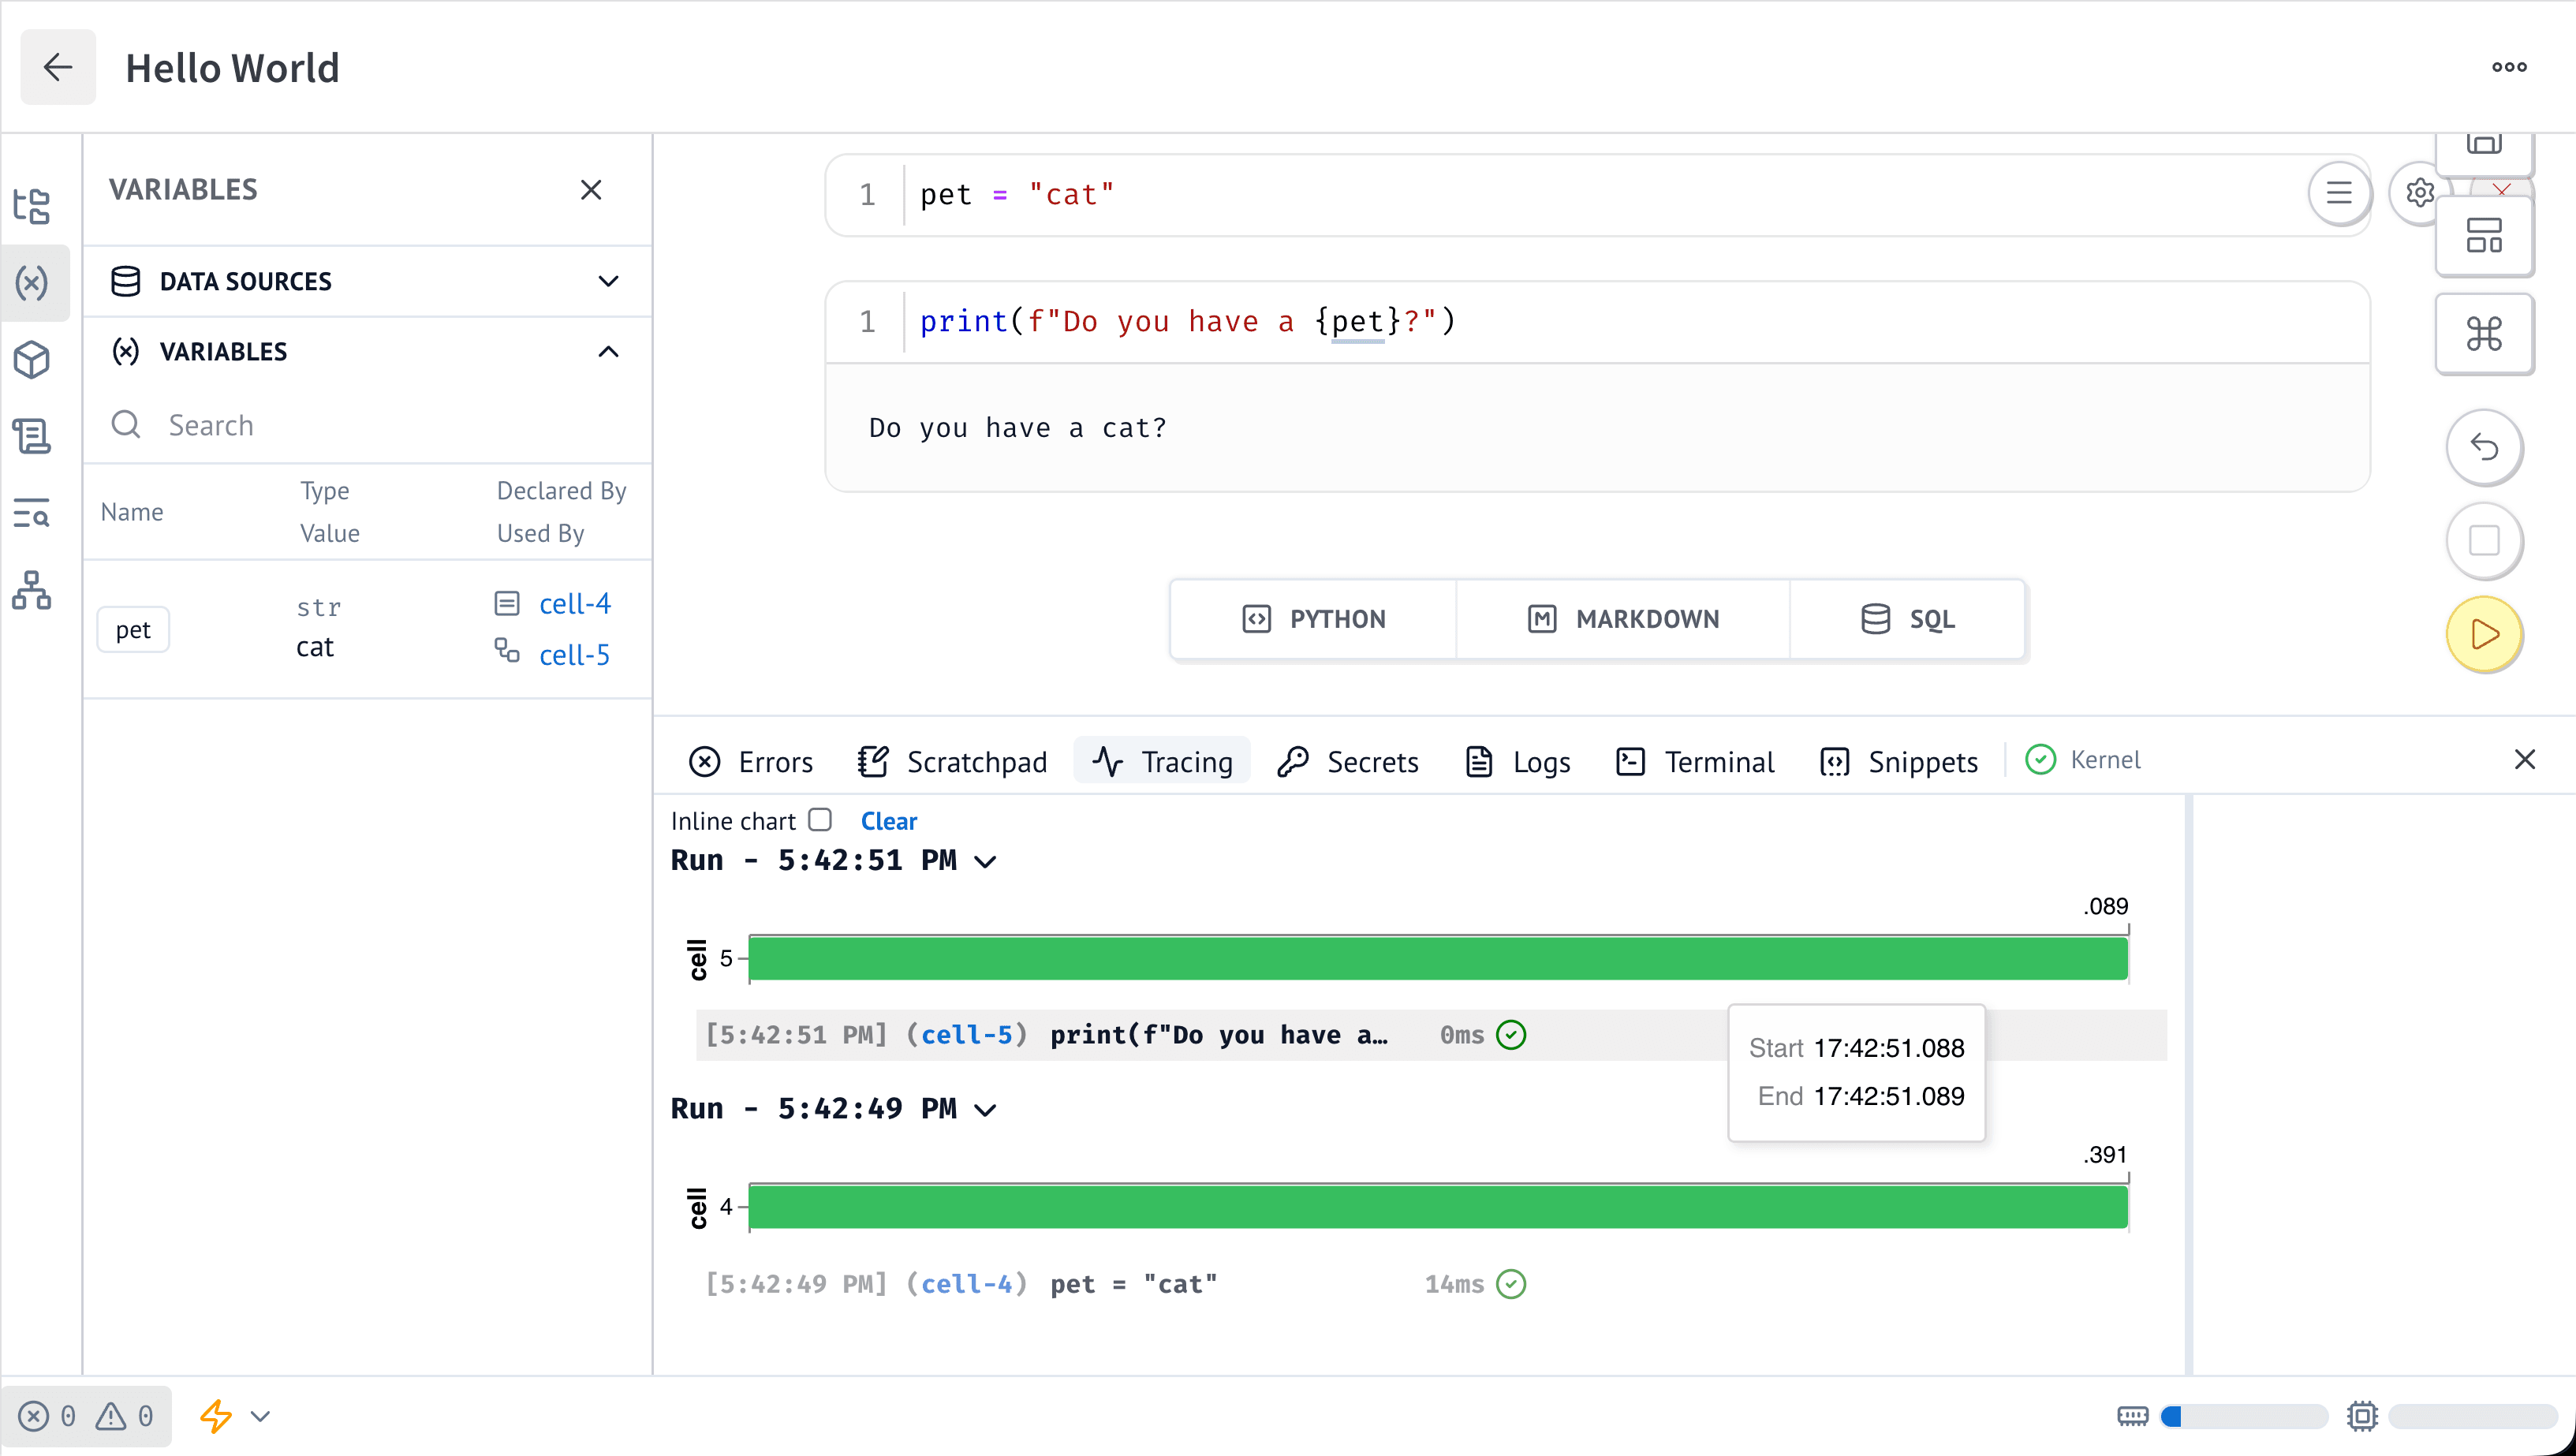
Each **Run** heading groups cells that ran during the same execution event. The horizontal bars show when each cell ran and compare its duration with other cells in the event. Each entry includes a cell link, code preview, duration, and status icon. The status icon indicates whether execution succeeded, failed, or was interrupted.
Short executions might display `0 ms` because durations are rounded. Hover over a trace entry to view precise start and end times. Select a cell link to open the corresponding notebook cell.
Select **Clear** to remove the displayed trace history. Clearing the history doesn't remove notebook cells or variables.
Enable **Inline chart** to display execution timing near the corresponding notebook cells.
The following image shows the "Hello World" notebook with the **Tracing** tab open in the developer panel. `cell-4` defines the variable pet, and `cell-5` uses it to produce the output "Do you have a cat?". Both cells completed successfully. The trace shows a duration of 14 ms for `cell-4` and `0 ms` for `cell-5`. A tooltip shows the precise start and end times for `cell-5`.
## Inspect execution traces
Use the **Tracing** tab to inspect the order and duration of cell executions. Traces can help you identify slow or failed cells and determine which cells ran during a reactive execution event.
### Read an execution trace
Each **Run** heading groups cells that ran during the same execution event. The horizontal bars show when each cell ran and compare its duration with other cells in the event. Each entry includes a cell link, code preview, duration, and status icon. The status icon indicates whether execution succeeded, failed, or was interrupted.
Short executions might display `0 ms` because durations are rounded. Hover over a trace entry to view precise start and end times. Select a cell link to open the corresponding notebook cell.
Select **Clear** to remove the displayed trace history. Clearing the history doesn't remove notebook cells or variables.
Enable **Inline chart** to display execution timing near the corresponding notebook cells.
The following image shows the "Hello World" notebook with the **Tracing** tab open in the developer panel. `cell-4` defines the variable pet, and `cell-5` uses it to produce the output "Do you have a cat?". Both cells completed successfully. The trace shows a duration of 14 ms for `cell-4` and `0 ms` for `cell-5`. A tooltip shows the precise start and end times for `cell-5`.
 ## View logs
Use the **Logs** tab to view standard output (`stdout`) and standard error (`stderr`) from notebook cells and the scratchpad. Use the logs to investigate execution failures that don't produce a clear inline error.
The following image shows the output `"Do you have a cat?"` logged at `[5:42:51 PM]` by the corresponding notebook cell.
## View logs
Use the **Logs** tab to view standard output (`stdout`) and standard error (`stderr`) from notebook cells and the scratchpad. Use the logs to investigate execution failures that don't produce a clear inline error.
The following image shows the output `"Do you have a cat?"` logged at `[5:42:51 PM]` by the corresponding notebook cell.
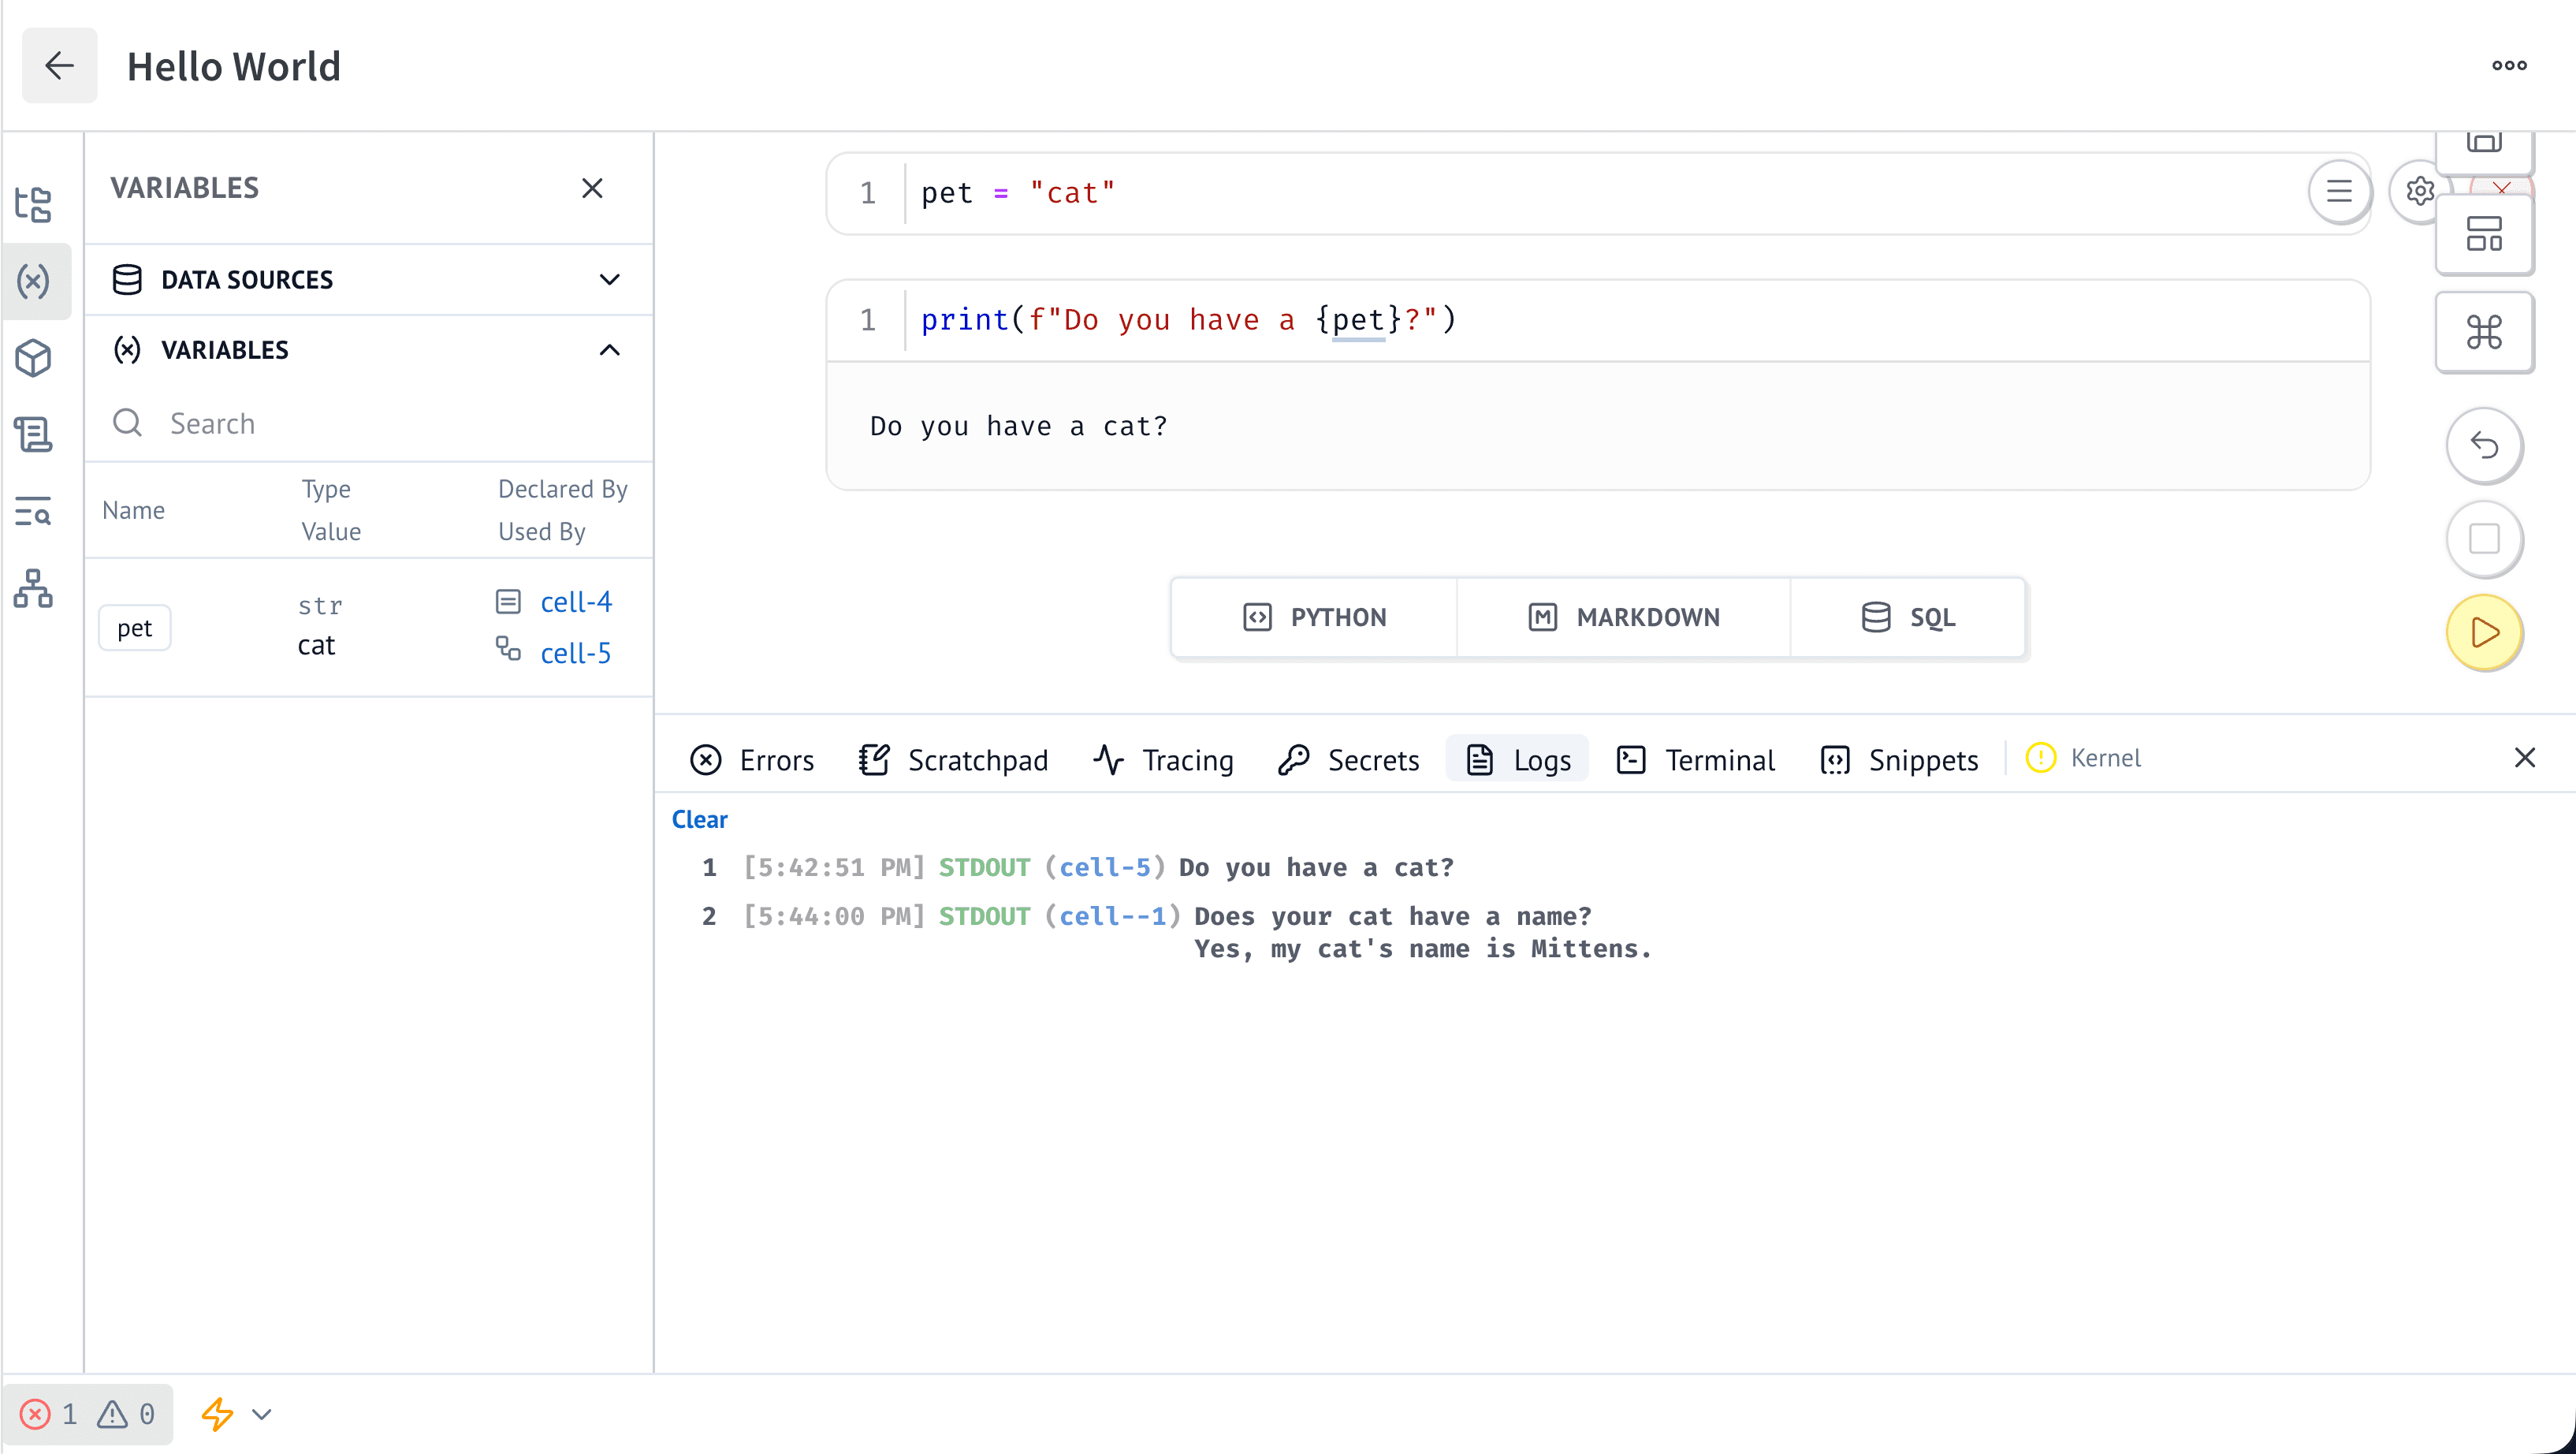 The **Logs** tab also includes output and errors from the [**Scratchpad**](/models/notebooks/developer-tools#use-the-scratchpad). In the image, the entry at `[5:44:00 PM]` is identified as `cell--1` and comes from the scratchpad.
## Use the terminal
Use the **Terminal** tab to open a shell in the notebook workspace. From the terminal, you can inspect files, run command-line tools, manage packages, and execute scripts. Changes made in the terminal apply to the same workspace as the notebook.
The **Logs** tab also includes output and errors from the [**Scratchpad**](/models/notebooks/developer-tools#use-the-scratchpad). In the image, the entry at `[5:44:00 PM]` is identified as `cell--1` and comes from the scratchpad.
## Use the terminal
Use the **Terminal** tab to open a shell in the notebook workspace. From the terminal, you can inspect files, run command-line tools, manage packages, and execute scripts. Changes made in the terminal apply to the same workspace as the notebook.